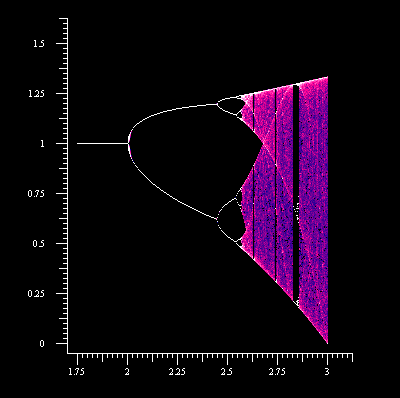
This is a plot of the logistic-type mapping fλ(x) = x(1 + λ(1 - x)). For each pixel along the horizontal axis, the value corresponding to its position is used as the value of λ for the iteration scheme xn+1 = xn(1 + λ(1 - xn)).
A suitable initial value of x, such as 0.5, is chosen, and the iteration scheme carried out by computer 150 times before plotting starts. Then the iteration scheme is the carried out (a further 1350 times for this plot) with the pixel that best approximates to the point (λ, xn) being plotted for each value of xn produced. The values of λ where branching can be seen on the plot correspond to the values of λ where period doubling occurs in the orbit of x.
On this plot, pixels were initially plotted in blue, then the colour was faded towards magenta, then towards white if the same pixel was plotted repeatedly. The fact that a pixel was plotted more than once doesn't (necessarily) mean that the same mathematical point was plotted more than once, but does mean that more than one point approximating to the same pixel was plotted, and the colour of the plot gives an indication of where points were plotted with greater or lesser density.