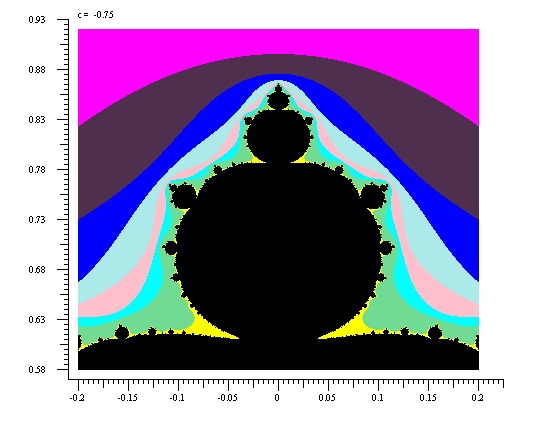
The plot on this page shows part of the Julia set of z2 + c for c = -0.75. The boundary between the coloured area and the black area allows us to visualize where this part of the Julia set lies.
For most |c| < 2, including the value of c = -0.75 used for this plot, the Julia set of z2 + c is a fractal and contains self-similar or quasi self-similar subsets of itself. The Julia set of a polynomial can be defined as the closure of the repelling periodic points of the polynomial, and it is the boundary of the basin of attraction of each attractive fixed point (including infinity) of the polynomial (ref. page 204 of Fractal Geometry by Falconer).
Each pixel within the plot represents a point in the complex plane, x + i y, according to the position of the centre of the pixel on the graph, and each such point in turn is used as the initial value of z for the iteration of Zn+1 = Zn2 + C. Each pixel is coloured according to how many iterations are required for the orbit of z to reach a distance of more than 2 from the origin.
If a point hasn't diverged after 50 iterations it is assumed it will not diverge and it is coloured black, so the boundary between the coloured area of the plot and the black area corresponds to the boundary between points that diverge to infinity and points that are not divergent.