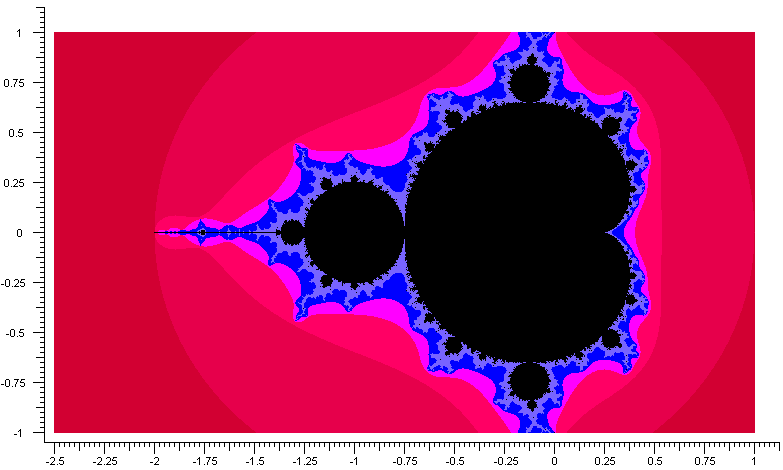
The plot on this page is the Mandelbrot set, which is probably becoming one of the most famous images of our times. The Mandelbrot set is defined as the set of parameters c for which the Julia set of z2 + c is connected. Such values of c are shown in black in the plot above.
A well-known theorem states that the Mandelbrot set consists of those values of c for which the iterates of Zn+1 = Zn2 + c are bounded when the initial value of z is zero, and this enables plots like the one above to be produced quite easily.
Each pixel in the plot above represents a point in the complex plane, and each such point in turn was taken to be the value of c for the iteration scheme Zn+1 = Zn2 + c, with Zo = 0.
The pixels representing values of c for which the orbit of z diverged to a distance greater than 2 from the origin (after which it must continue to diverge) were coloured according how many iterations were required for this to happen, and those that had not diverged to a distance greater than 2 after 60 iterations were plotted in black. The Mandelbrot set is itself connected, but at some points it is so slim that it hasn't shown up on this plot.