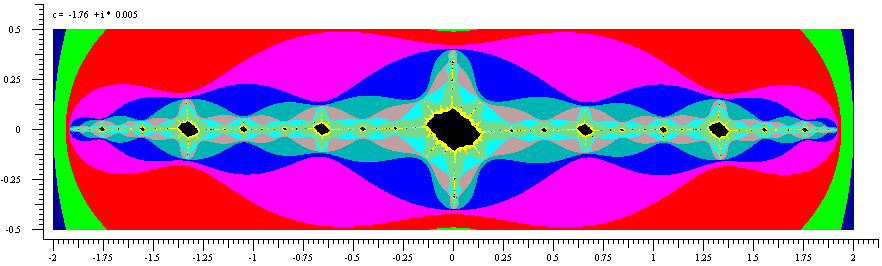
The plot on this page is of the Julia set of z2 + c, with c = -1.76 + 0.005i. The value of c in this case lies within the miniature version of the Mandelbrot set shown in the plot to the left of this one on the main page. The Mandelbrot set contains many smaller versions of itself, some along its "hairs" as well as along the "needle".
When c is taken from one of these miniature versions, the Julia set contains miniature versions of the Julia set that would be obtained by taking the value of c from the corresponding position in the main part of the Mandelbrot set.
This Julia set was plotted using the same technique as the one shown in the middle of the top row of the main page of this web site. Each pixel represents a point in the complex plane and each such point in turn is used as the initial value of z for the iteration Zn+1 = Zn2 + c. Each pixel is coloured according to how many iterations are required for the orbit of z to reach a distance of 2 or more from the origin. The pixels corresponding to points that haven't diverged after 50 iterations are coloured black.
The boundary between the coloured area and the black area gives a visual image of where the Julia set lies. Parts of the black (ie non-divergent) area of the Julia plot above are very thin, so thin they haven't shown up in places, but we know the Julia set is connected as the value of c belongs to the Mandelbrot set.